| Site HB-01 | |||
|---|---|---|---|
| Time Frame | BIBI (Condition) | FIBI (Condition)a | RBP (Condition) |
| 2019 Results | 2.71 (Poor) | -- | 155 (Comparable) |
| Cumulative Average (2007-2019) | 2.63 (Poor) | 2.67 (Poor) | 127 (Supporting) |
| 3-year Running Average | 2.81 (Poor) | 2.67(Poor) | 136 (Supporting) |
a) Fish data collected in 2015, 2016, and 2018.
| Site HB-02 | |||
|---|---|---|---|
| Time Frame | BIBI (Condition) | FIBI (Condition)a | RBP (Condition) |
| 2022 Results | 1.57 (Very Poor) | 2.00 (Poor) | 136 (Supporting) |
| Cumulative Average (2007-2022) | 2.51 (Poor) | 2.58 (Poor) | 128 (Supporting) |
| 3-year Running Average | 1.86 (Very Poor) | 2.22 (Poor) | 128 (Supporting) |
a) Fish data collected in 2015, 2016, 2018, and 2022.
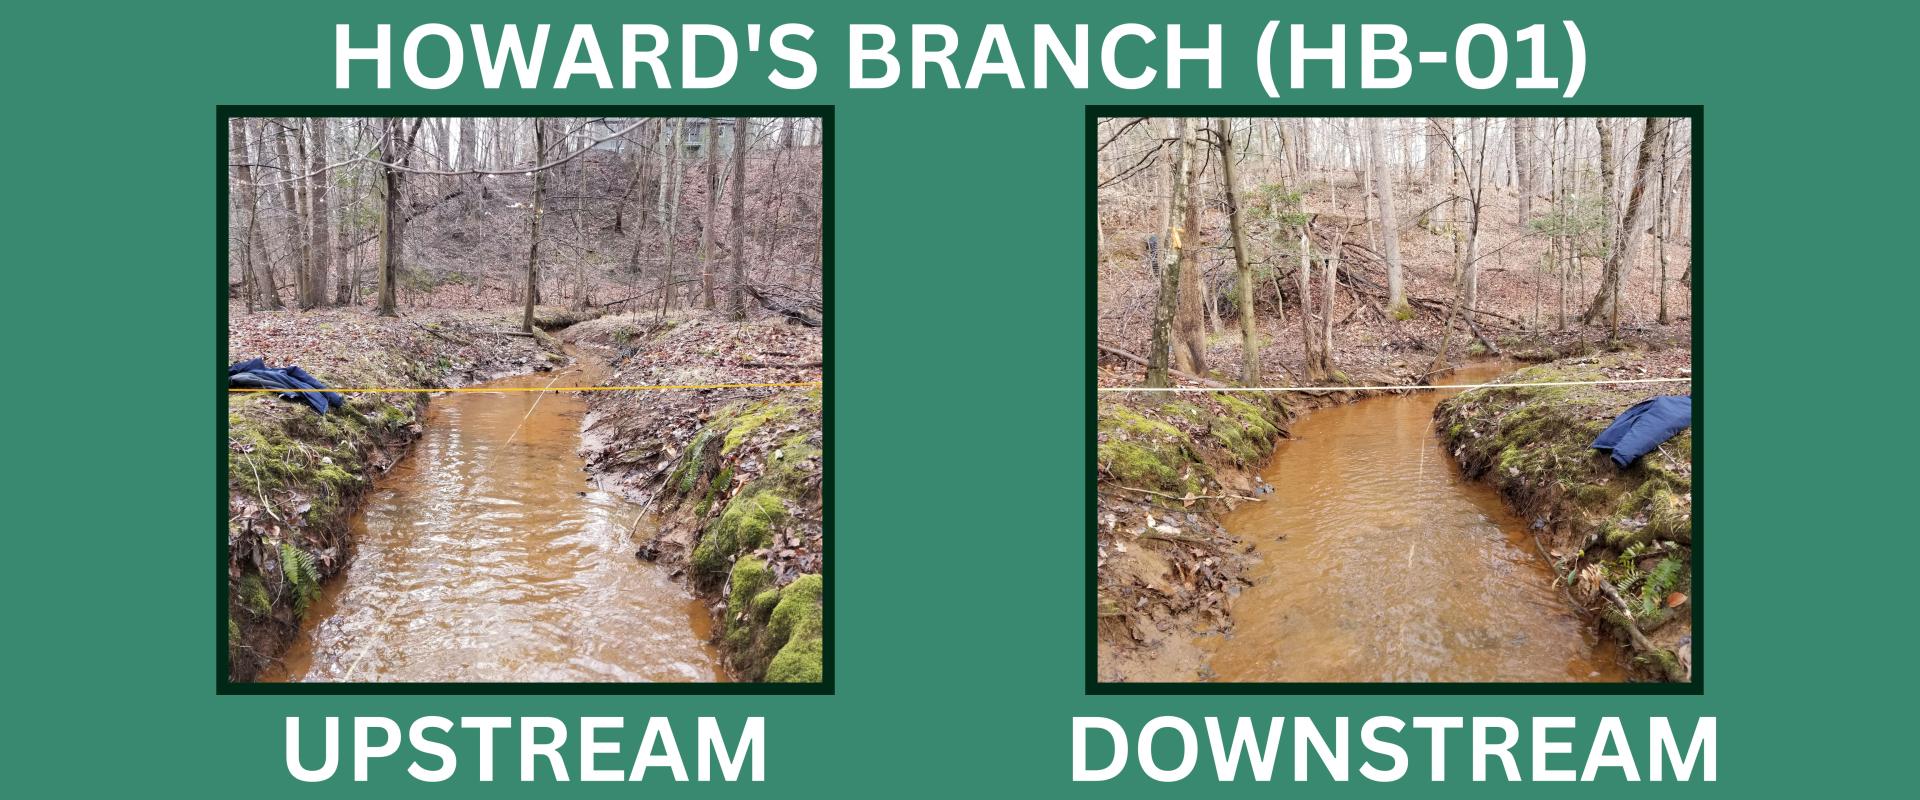
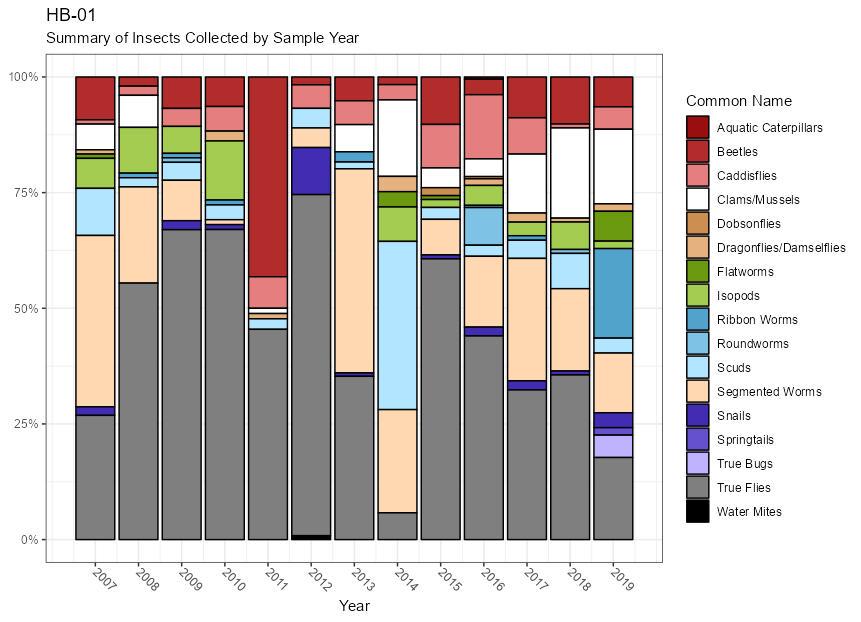
Site HB-01: HB-01 received a BIBI score of 2.71 (Poor) in 2019, the final year it was sampled before being retired from the targeted monitoring program. The cumulative average BIBI score for 2007-2019 is 2.63 (Poor). For most years non-biting midges were the dominant organism, with clams, ribbon worms, riffle beetles, and caddisflies being consistently well represented.
HB-01 Summary of Insects Collected by Sample Year:
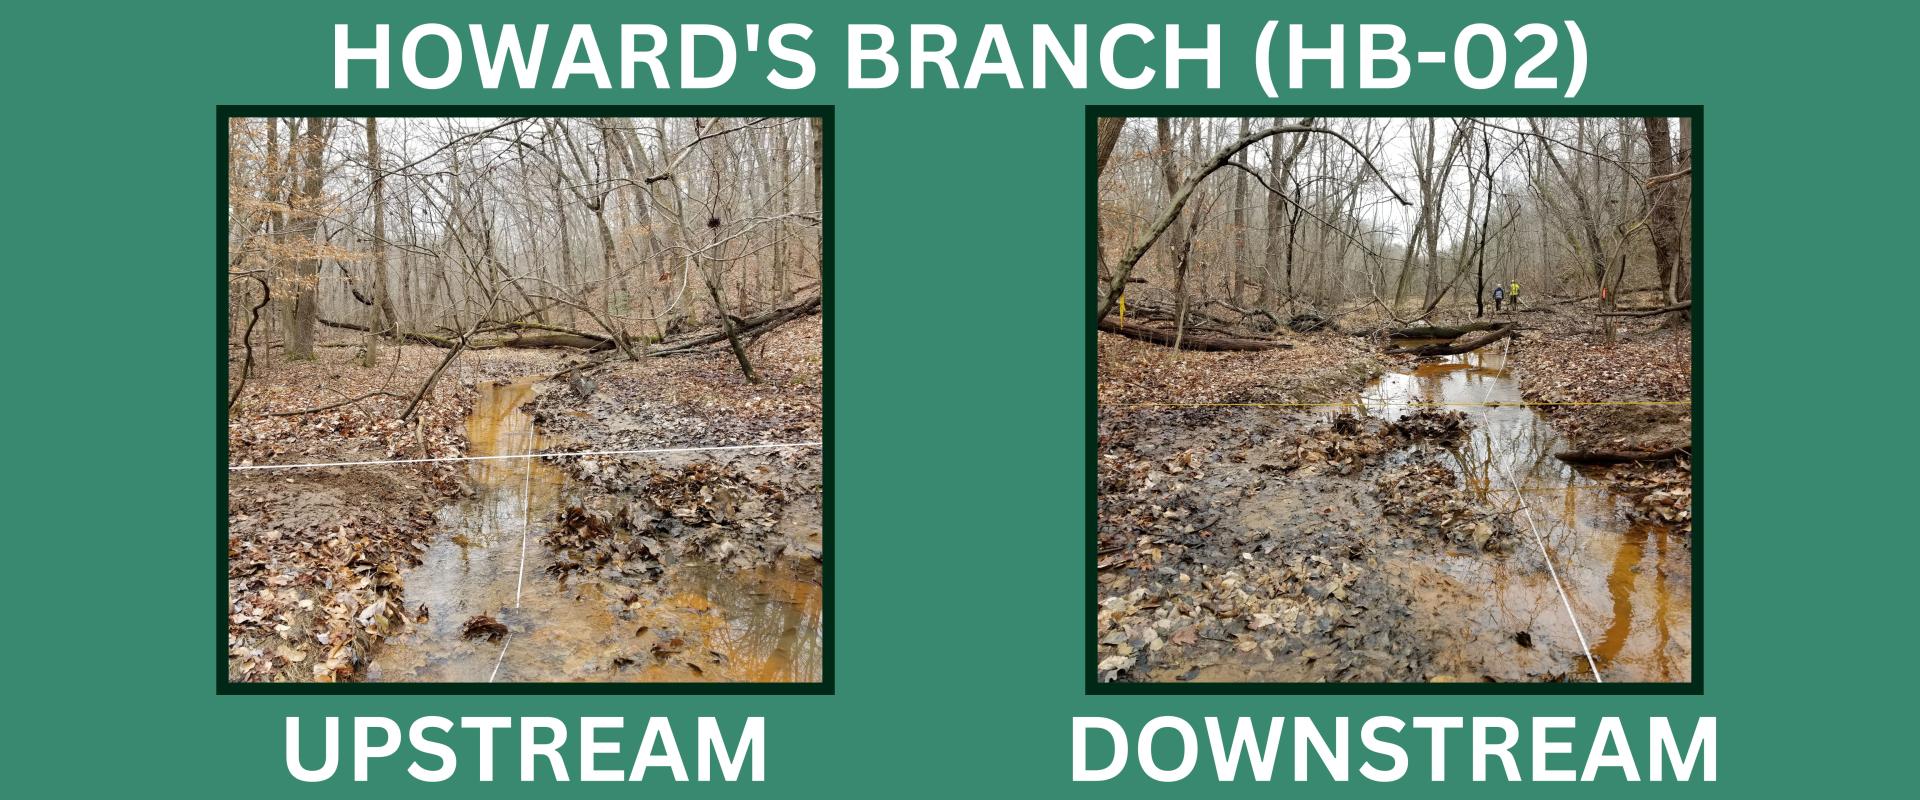
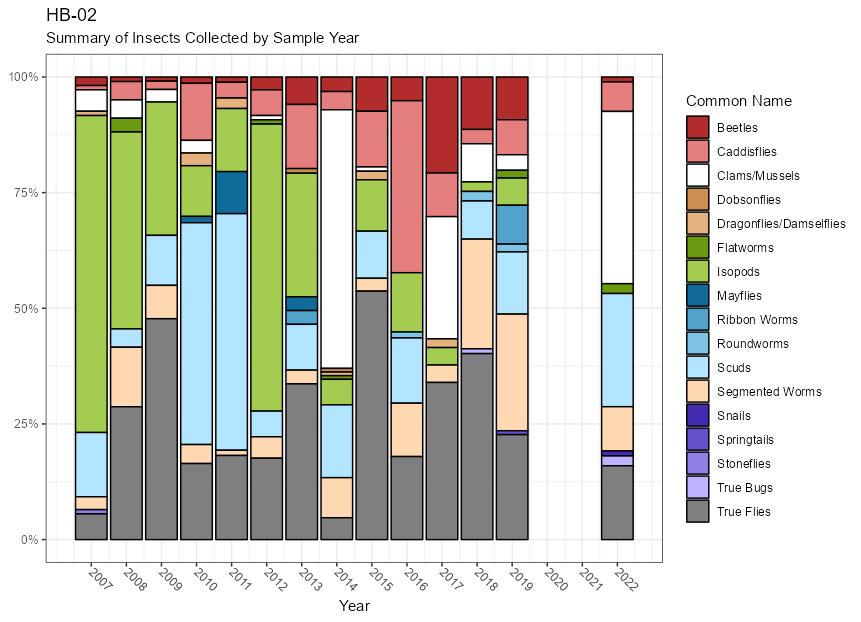
Site HB-02: Located approximately 500 feet upstream of the restoration project area, HB-02 was sampled from 2007 to 2019, after which it was retired from the targeted monitoring program. The site was sampled again in 2022 as part of a separate study. The site received a BIBI score of 1.57 (Very Poor) in 2022. Benthic macroinvertebrate community conditions may be declining here, as the cumulative average score from 2007 to 2016 is 2.86 (Poor), compared to a cumulative average score of 1.64 (Very Poor) between 2017 and 2022. In 2022, clams comprised over 50% of all organisms. Isopods - the dominant or co-dominant organism in many sampling years - were absent from the sample in 2022. Although isopod numbers had been declining at HB-02, 2022 marks the first and only year they were not present at the site.
HB-02 Summary of Insects Collected by Sample Year:
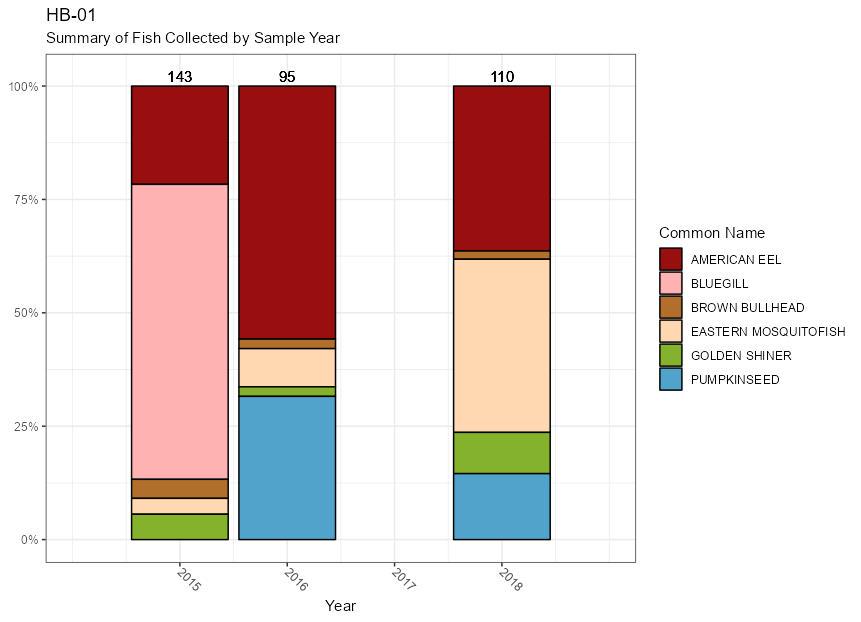
Site HB-01: TThe site was fished in 2015, 2016, and 2018, improving from a score of 2.33 (Poor) to a score of 3.00 (Fair) over that time frame. Bluegill (Lepomis macrochirus) made up over 50 percent of the sample in 2015 but were absent from the 2016 and 2018 samples. The same five species were found in 2016 and 2018 - golden shiner (Notemigonus crysoleucas), American eel (Anguilla rostrata), pumpkinseed (Lepomis gibbosus), brown bullhead (Ameiurus nebulosus), and eastern mosquitofish (Gambusia holbrooki) - but the more even distribution of species in 2018 resulted in an improved FIBI score.
HB-01 Summary of Fish Collected by Sample Year:
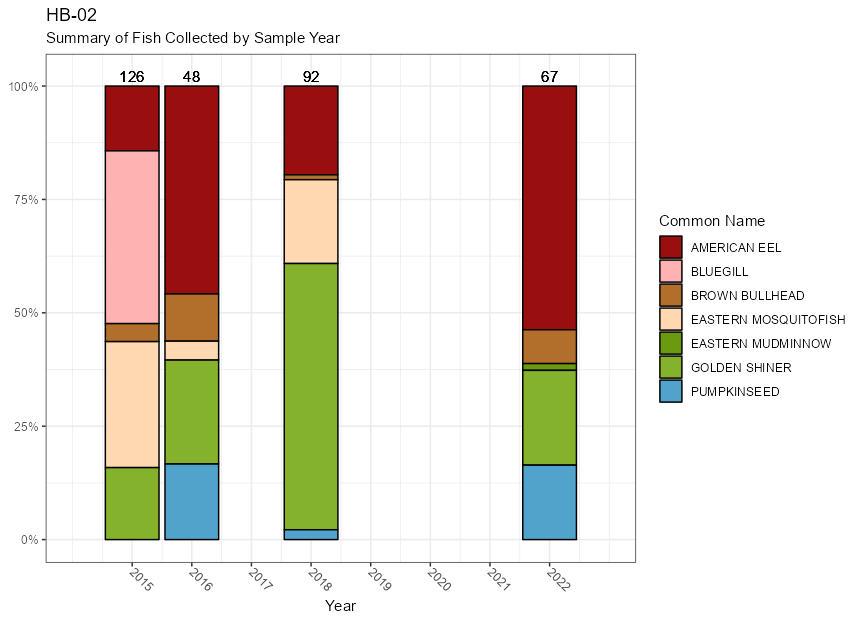
Site HB-02: The site was fished in 2015, 2016, 2018 and 2022. The 2022 sample resulted in a FIBI score of 2.00 (Poor). Species observed in 2022 were golden shiner, American eel, pumpkinseed, brown bullhead, and eastern mudminnow (Umbra pygmaea) . Similar to HB-01, bluegill was the dominant species in 2015 but was absent from all subsequent samples. 2022 was the first year that eastern mudminnows were found at the site.
HB-02 Summary of Fish Collected by Sample Year:
Site HB-01: The 2019 RBP score of 155 (Comparable to Reference Conditions) continued a general trend of increasing scores dating back to 2015. The final cumulative average and the three-year running average are 127 (Supporting) and 136 (Supporting), respectively.
Site HB-02: The site received an RBP score of 136 (Supporting) in 2022. Both the cumulative average score and the three-year running average score are 128 (Supporting).
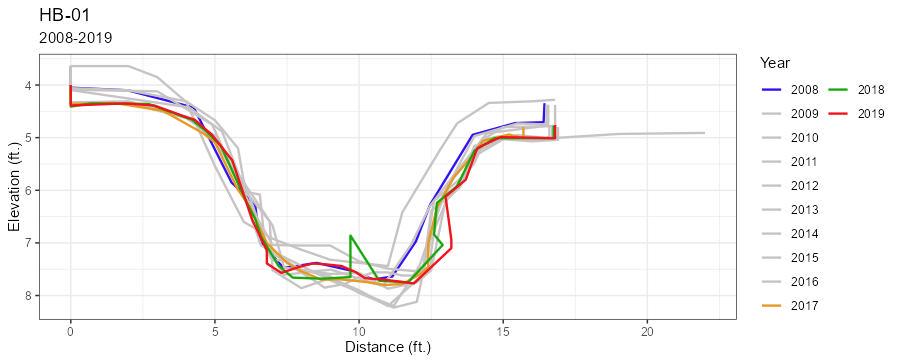
Site HB-01: In 2019, channel cross-section conditions were relatively stable. The 2018 measurement shows about a 0.25-foot increase in stream bottom elevation over the 2017 measurement, indicative of a pulse of sediment delivered to the system. The 2019 measurement indicates the sediment pulse is no longer evident and the channel more closely resembles 2017 conditions.
HB-01 Cross-Section Comparison:
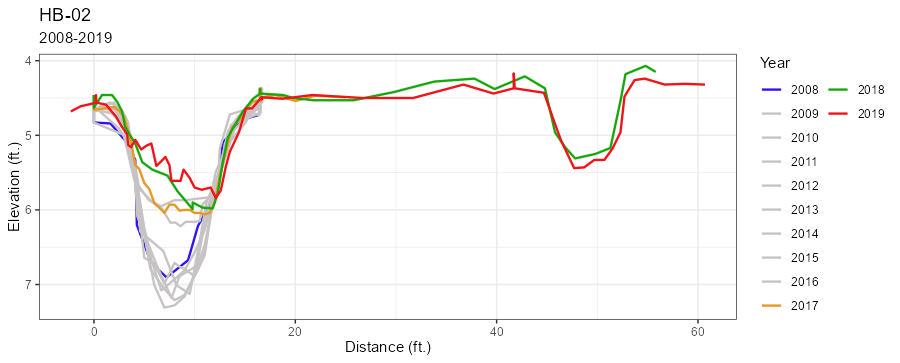
Site HB-02: Geomorphically, this site has experienced some meaningful changes. Between 2014 and 2019, the channel aggraded by over 1.5 feet. The surrounding floodplain between the monuments also showed classic near-channel aggradation associated with a high sediment supply system (Malanson 1993). The ongoing impact of this sedimentation is unclear, but excessive sediment is known to decrease the occurrence of sensitive species in stream systems (Waters 1995). This aggradation has possibly contributed to the depressed BIBI scores from 2017 to 2022. In 2018 it was also noted that the upstream portion of the reach was beginning to braid and expand, as evidenced by the formation of a secondary channel in 2018 as portrayed in the graph below.
HB-02 Cross-Section Comparison:
| HB-01 | |||
|---|---|---|---|
| Year | BIBI (Condition) | FIBI (Condition) | RPB (Condition) |
| 2007 | 1.86 (VP) | --- | 110 (PS) |
| 2008 | 2.43 (P) | --- | 116 (PS) |
| 2009 | 2.14 (P) | --- | 120 (PS) |
| 2010 | 2.71 (P) | --- | 138 (S) |
| 2011 | 2.71 (P) | --- | 123 (PS) |
| 2012 | 2.71 (P) | --- | 127 (S) |
| 2013 | 2.43 (P) | --- | 119 (PS) |
| 2014 | 2.71 (P) | --- | 131 (S) |
| 2015 | 3.00 (F) | 2.33 (P) | 123 (PS) |
| 2016 | 3.00 (F) | 2.33 (P) | 143 (S) |
| 2017 | 3.29 (F) | --- | 138 (S) |
| 2018 | 2.43 (P) | 3.00 (F) | 134 (S) |
| 2019 | 2.71 (P) | -- | 124 (PS) |
| HB-02 | |||
|---|---|---|---|
| Year | BIBI (Condition) | FIBI (Condition) | RBP (Condition) |
| 2007 | 2.14 (P) | --- | 99 (NS) |
| 2008 | 2.71 (P) | --- | 134 (S) |
| 2009 | 2.71 (P) | --- | 115 (PS) |
| 2010 | 3.57 (F) | --- | 134 (S) |
| 2011 | 3.00 (F) | --- | 134 (S) |
| 2012 | 2.14 (P) | --- | 136 (S) |
| 2013 | 3.86 (P) | --- | 126 (S) |
| 2014 | 2.14 (P) | --- | 117 (PS) |
| 2015 | 3.00 (F) | 3.67 (F) | 125 (PS) |
| 2016 | 3.29 (F) | 2.33 (P) | 144 (S) |
| 2017 | 1.00 (VP) | --- | 140 (S) |
| 2018 | 2.14 (P) | 2.33 (P) | 124 (PS) |
| 2019 | 1.86 (VP) | -- | 124 (PS) |
| 2020 | -- | -- | -- |
| 2021 | -- | -- | -- |
| 2022 | 1.57 (VP) | 2.00 (P) | 136 (S) |
| All Station Summary | ||||||
|---|---|---|---|---|---|---|
| Average BIBI (SD) | 3-Year Average BIBI (SD) | Average RPB (SD) | 3-Year Average RBP (SD) | Average FIBI (SD) | 3-Year FIBI Average (SD) | |
| HB-01 | 2.63 (0.38) | 2.81 (0.44) | 127 (13) | 136 (21) | 2.67 (0.34) | 2.67 (0.34) |
| HB-02 | 2.51 (0.80) | 1.86 (0.29) | 128 (12) | 128 (7) | 2.58 (0.74) | 2.22 (0.19) |
SD = Standard Deviation