The mixing of fresh and salt water defines an estuary, and a large estuary like the Chesapeake has an ever-changing and fascinating pattern of salinity influenced mainly by the varying flows of freshwater, but also by Coriolus forces from the earth's rotation. On a local level the heating and cooling of surface layers, and wave-driven mixing can play major roles in altering salinity. Looking at a nautical chart of the Severn River, it is natural to think of it as a slowly flowing river gradually emptying into the Chesapeake near Annapolis. In fact, most of the water in the tidal Severn comes from the Chesapeake rather than from the local watershed. The foot-high tide sloshes shallow water from the Bay into and out of the Severn twice a day, mixing Severn and Bay water over a time scale of weeks. By comparison, the volume of fresh water coming in from the Severn watershed is normally quite modest, and it is only near the heads of the numerous creeks off the Severn that the salinity drops measurably. Most of the time the Severn's salinity is the same from Annapolis to well above Round Bay, and this is close to the salinity of the Chesapeake at the Bay Bridge. The Severn is about three-fourths of the way up the Chesapeake from the Atlantic to the mouth of the Susquehanna, which is the source of most of the water in the Severn. The main body of the Severn River is like a cove off the major Chesapeake estuary, onto which Severn tributaries form sub-estuaries.
Salinity is an important determinant of life forms in the Severn, and the continuing salinity changes profoundly influence its natural resources. Salinity changes with the season and from year to year, depending on the Susquehanna flow. In rainy years the low salinity keeps sea nettles away until the end of the summer.
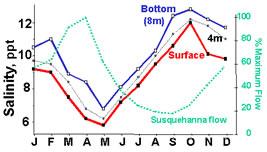
Oysters grow best at salinities of about 15 parts per thousand, higher than the Severn's average, but since their major enemy Dermo requires even more salt than oysters, the Severn is considered a good site for oyster restoration projects. The graph shows the monthly average of 8 (1990 through 1997) salinity measurements in parts per thousand (ppt). (Sea water salinity is about 35 parts per thousand, or 3.5% salt by weight.) The figure shows that the average surface salinity of the Severn varies over a two- fold range, from about 1/6 of seawater in May to about 1/3 of seawater in November. These changes are driven by the varying freshwater flows of the Susquehanna River, as shown by the light blue dashed line. The northward flow of salty ocean water in the deep Chesapeake supplies salt to the Severn, exerting more influence in the fall when the freshwater flow is minimal. In years of low rainfall such as 1999, the Severn's salinity can be several ppt higher than the monthly average for much of the year, and wet years are correspondingly fresher. Monthly measurements of the surface salinity of the Severn at the Route 50 bridge are carried out by the Maryland Department of Natural Resources and are reported on their website.
The figure also shows salinity measurements 4 meters below the surface and near the bottom at 8 meters. These deeper samples show higher salinities than the surface, illustrating the typical estuarine layering of fresher water over denser saltier water. The increasing density with depth reflects a stable layering which resists vertical mixing, giving rise to one of the Bay's more difficult environmental problems. When nutrient-driven bacterial growth depletes oxygen from bottom water, the lighter oxygen-rich surface water cannot easily mix with it, leading to low oxygen stress on bottom-dwelling organisms throughout the Chesapeake including the Severn.
Tides in the Severn
Like the rest of the Chesapeake, the Severn has two high tides and two low tides daily. The difference between high and low tides is typically about one foot, which is the lowest of any location on the Chesapeake. Tide predictions for the Severn are available online.
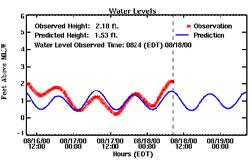
The Severn is fortunate to have a web-accessible water height gauge operated by NOAA at the US Naval Academy in Annapolis. This site shows current water heights (red line) and compares them with tide predictions (blue line), as shown in this figure. Differences between predicted and actual water heights are generally attributable to wind, with strong southerly winds pushing water heights up in the northern Bay including the Severn. More commonly, strong northerly and northwesterly winds drive water out of the Bay and lower the water height, as happened on August 17, 2000 when the observed water height dropped from above to below the predicted level. Several days of strong northerly winds, typically in the winter, can drive water levels in the Severn down more than two feet below normal levels.